GSC Seasonality Analysis
Analyze seasonal traffic trends for your pages and queries using Google Search Console data — understand when your content peaks and plan your content calendar accordingly.
How to open
From the left sidebar, go to Beta → GSC Seasonality Analysis.
Summary metrics
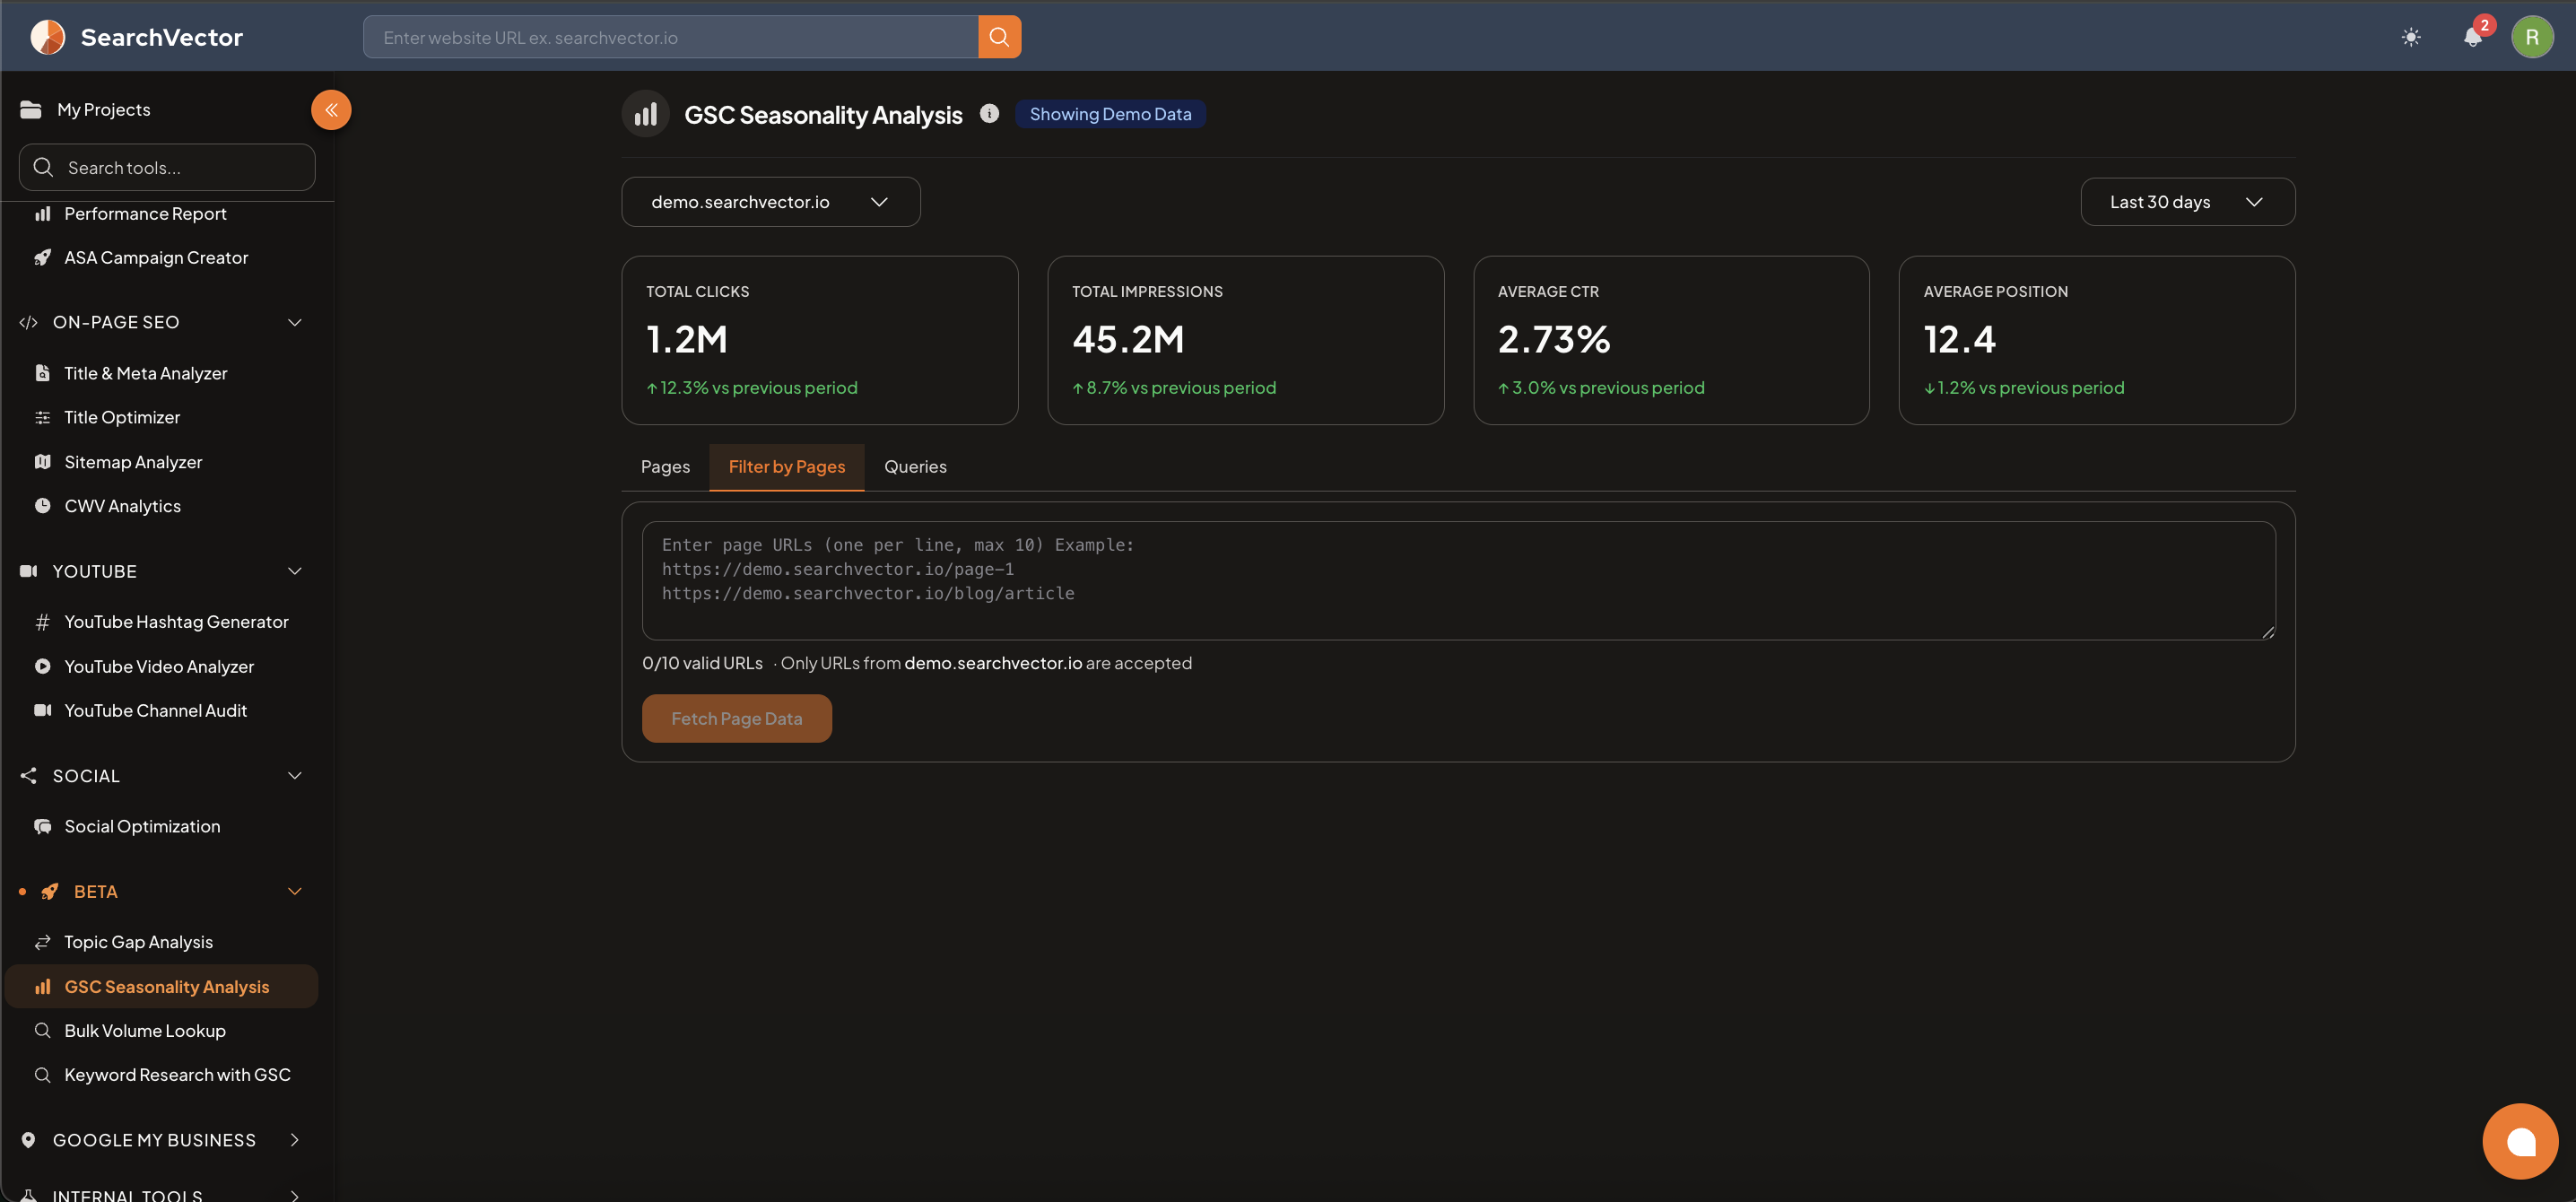
At the top, 4 account-level metrics are shown with period-over-period change:
| Metric | Description |
|---|---|
| Total Clicks | Total organic clicks for the selected period |
| Total Impressions | Total organic impressions |
| Average CTR | Click-through rate across all pages/queries |
| Average Position | Average ranking position |
Analysis tabs
| Tab | What it shows |
|---|---|
| Pages | Seasonal trends for all pages on your domain |
| Filter by Pages | Enter up to 10 specific page URLs to analyze their seasonal trends |
| Queries | Seasonal trends for specific search queries |
Filter by Pages
- Select the Filter by Pages tab.
- Enter up to 10 page URLs (one per line) — only URLs from your connected domain are accepted.
- Click Fetch Page Data to load the seasonal trend for those specific pages.
note
Only URLs from your connected GSC property are accepted. Paste full URLs including https://.
How to use the insights
- Identify months when specific pages see traffic spikes — publish or update content before the seasonal peak.
- Find pages that had a seasonal high last year but are declining this year — investigate and refresh the content.
- Use the Queries tab to find seasonal keywords and create new content targeting them ahead of the season.
tip
If a page peaked in November last year, start optimizing and promoting it in September to build ranking momentum before the season arrives.