Apple Ads Performance Report
Track your Apple Search Ads performance across all campaigns — spend, impressions, taps, installs, and cost-per-install — with period-over-period comparison.
How to open
- From the left sidebar, go to Apple Ads → Performance Report.
- Select your Ad Account.
- Set your date range and comparison period (default: last 7 days vs previous 7 days).
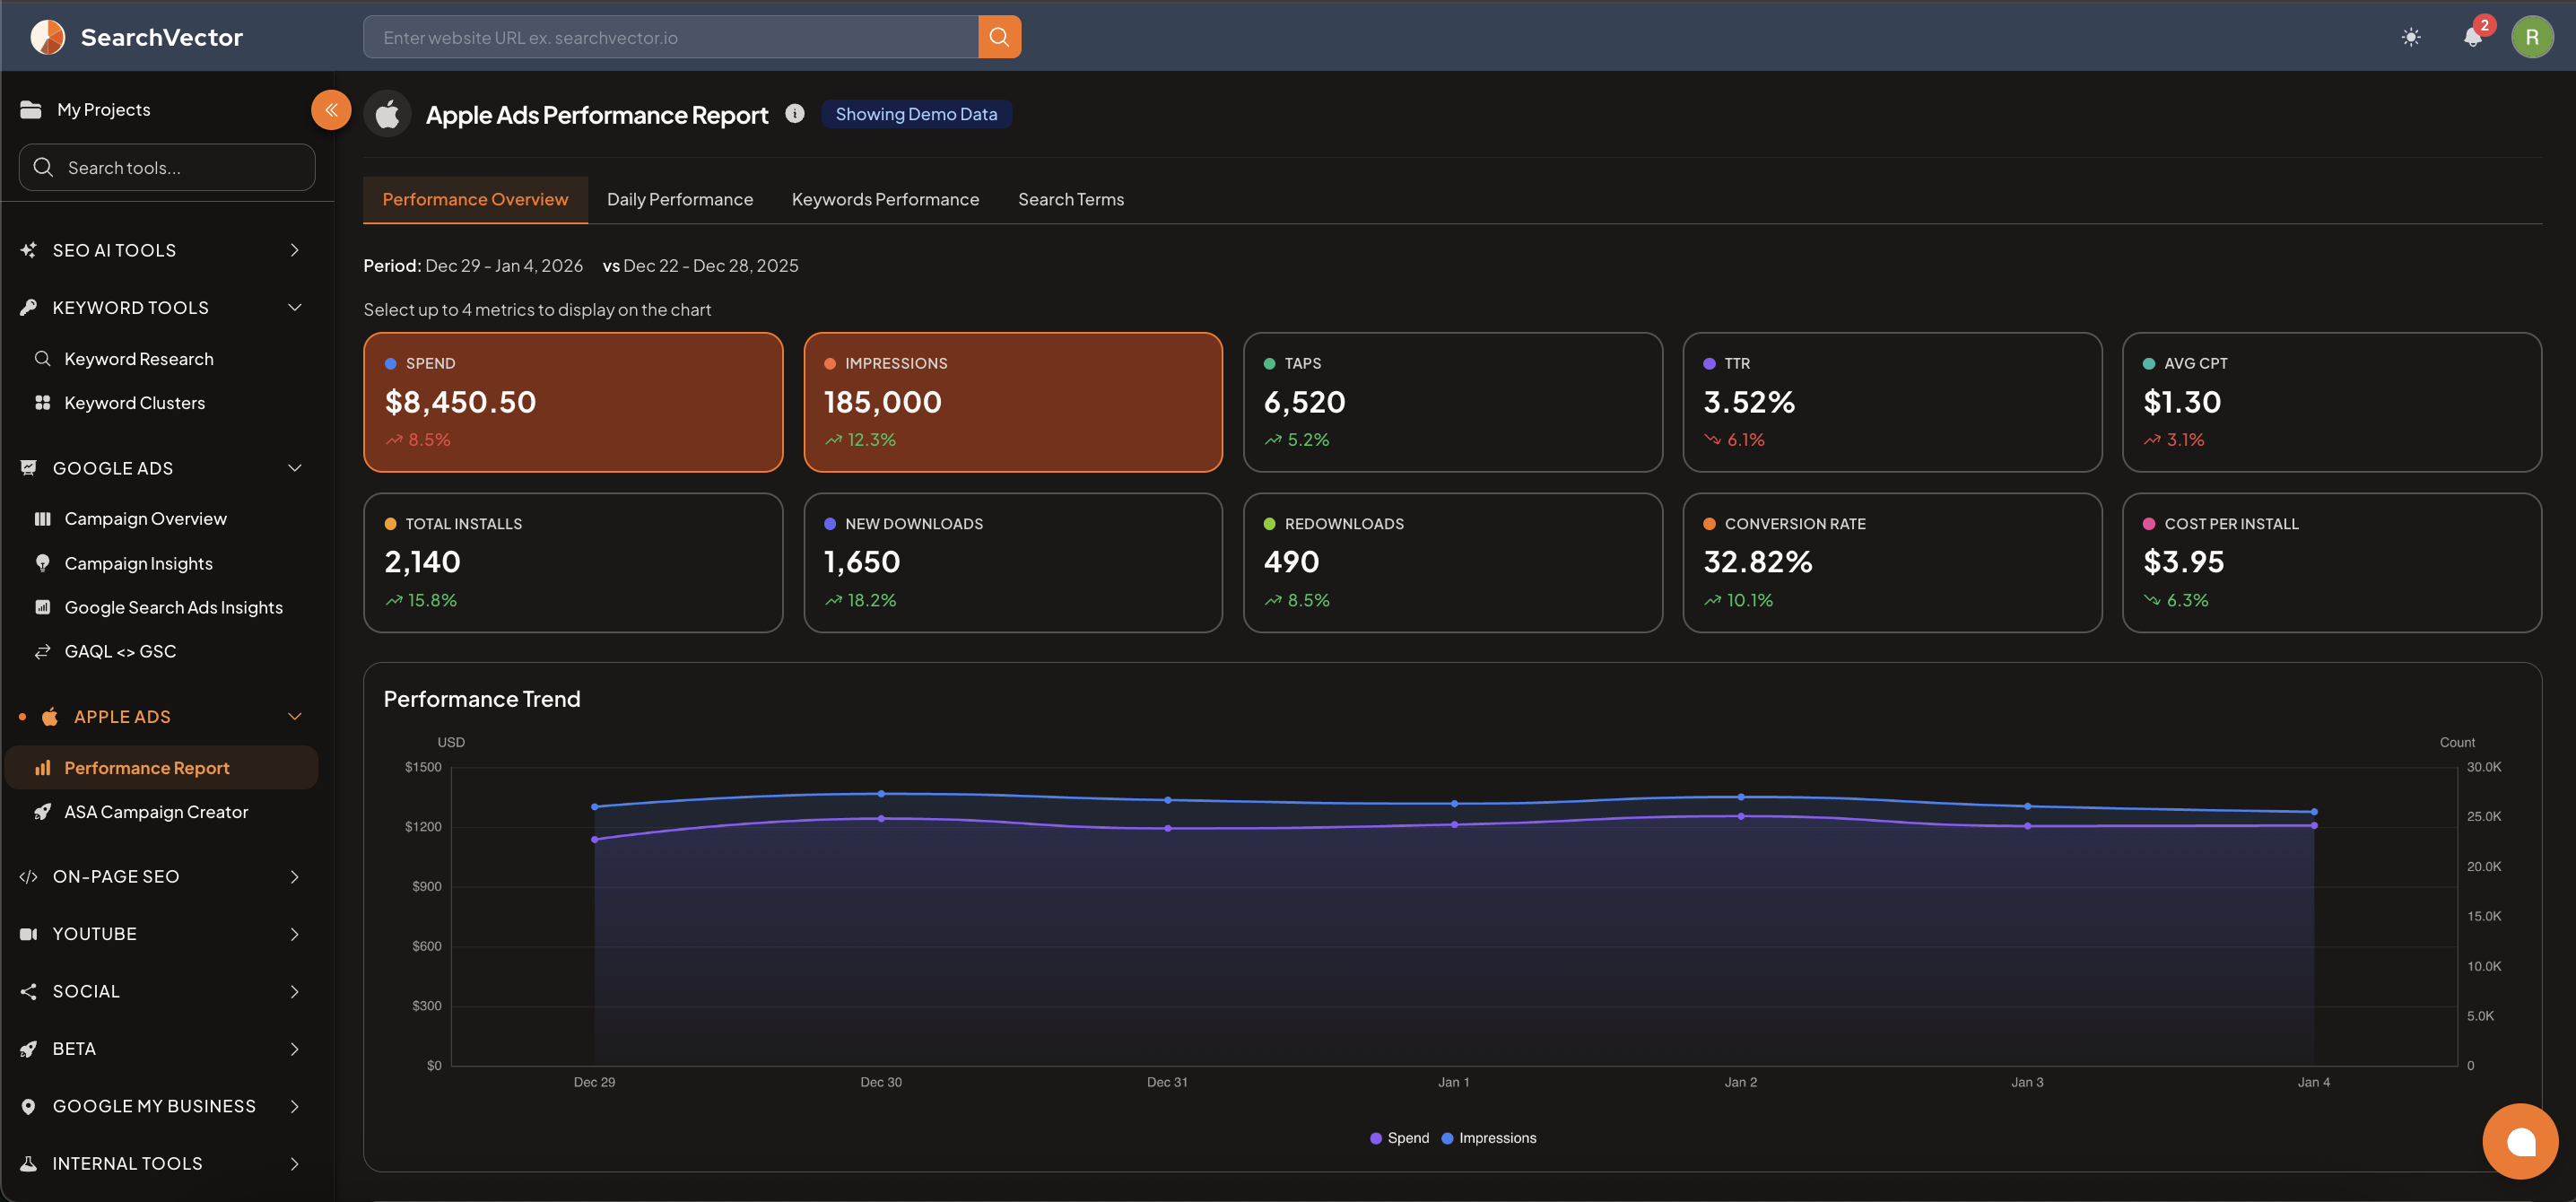
Summary metrics
At the top, key metrics are shown with period-over-period change indicators:
| Metric | Description |
|---|---|
| SPEND | Total amount spent on Apple Search Ads |
| IMPRESSIONS | Total times your ads were shown |
| TAPS | Total times users tapped your ad |
| TTR | Tap-through rate (Taps ÷ Impressions) |
| AVG CPT | Average cost per tap |
| TOTAL INSTALLS | Total app installs from ads |
| NEW DOWNLOADS | First-time app downloads |
| REDOWNLOADS | Users reinstalling your app |
| CONVERSION RATE | Installs ÷ Taps |
| COST PER INSTALL | Total spend ÷ Total installs |
You can select up to 4 metrics to display on the performance trend chart.
Analysis tabs
| Tab | What it shows |
|---|---|
| Performance Overview | Summary metrics with trend chart and period comparison |
| Daily Performance | Day-by-day breakdown of spend, taps, and installs |
| Keywords Performance | Performance broken down by keyword |
| Search Terms | Actual search terms that triggered your ads |
Performance Trend chart
The line chart displays your selected metrics over the chosen date range, making it easy to spot daily patterns, spikes, or drops in campaign performance.
Requirements
- Apple Search Ads account connected via secure OAuth.
- Connect from Apple Ads → ASA Campaign Creator or account settings.
note
SearchVector connects to Apple Search Ads via their official API with read-only access. Your Apple credentials are never stored.
tip
Compare New Downloads vs Redownloads to understand whether your ads are acquiring new users or re-engaging existing ones. Adjust campaign targeting accordingly.